Property Analytics Explained
Where can I find analytics about my properties?
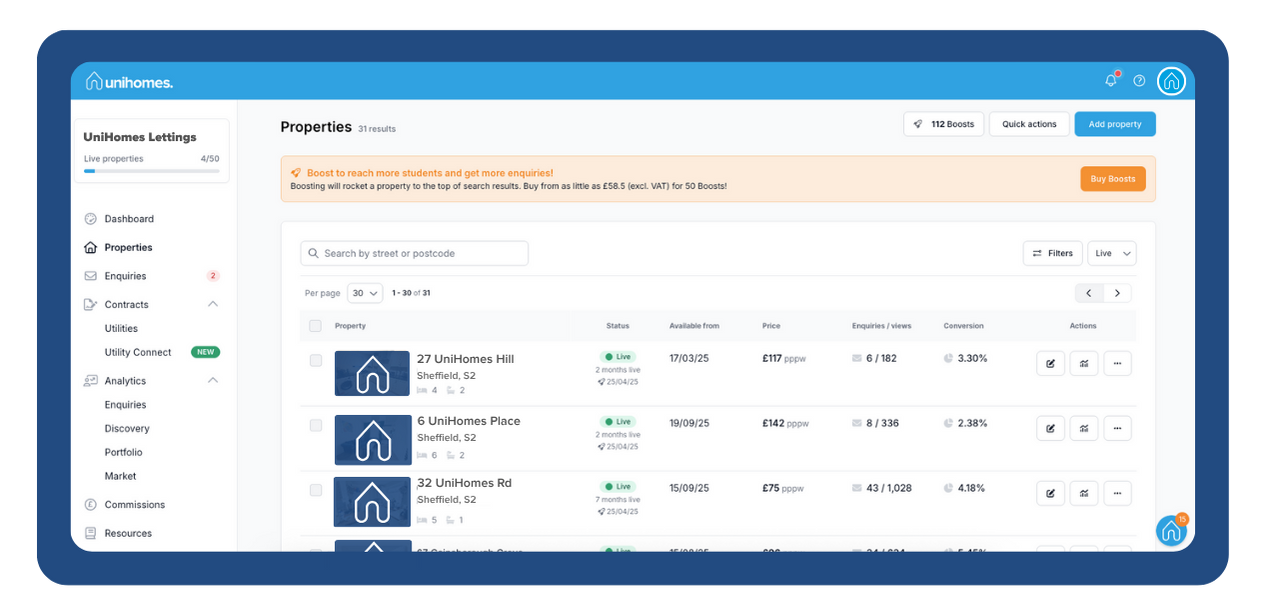
You can view performance data for your listings directly within the letting agent portal. Analytics are integrated into the Dashboard and the Properties page for easy access.
Dashboard: Get a snapshot of your entire portfolio’s performance and overall presence on UniHomes.
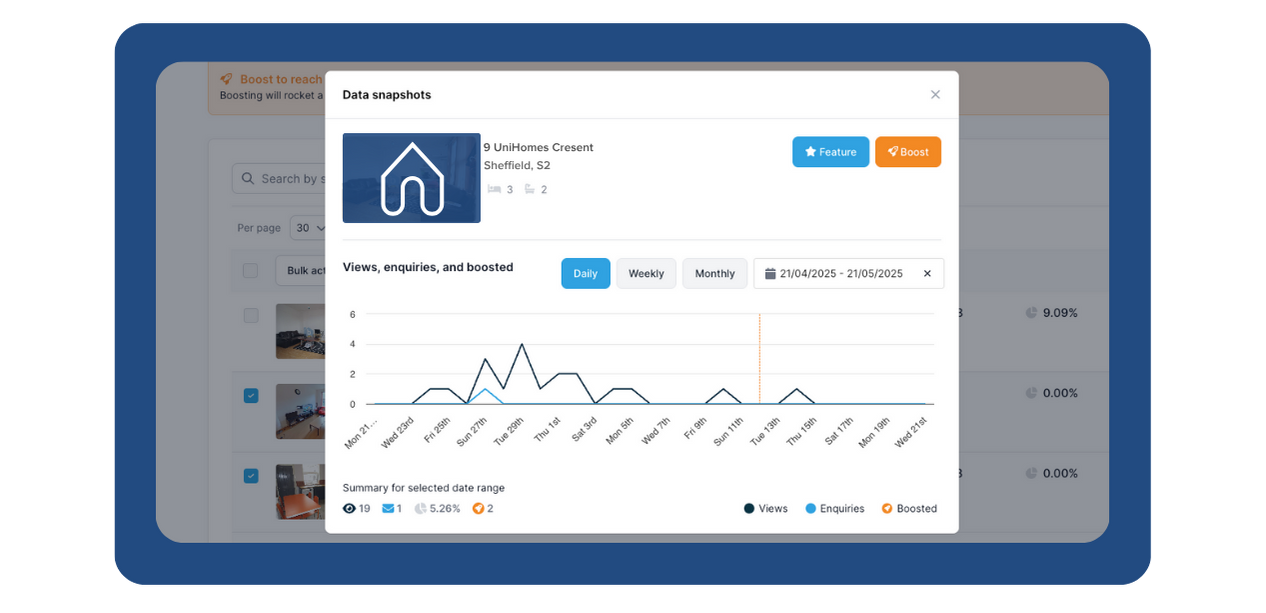
Properties Page: This page shows each listing’s performance on the UniHomes website. Just click the data snapshot button to see a chart tracking each property's performance.
Need more insight? Your Account Manager is happy to help – give us a call on 0330 822 0266.
How can I improve the performance of my listings?
If any properties aren’t attracting the attention you expected, you can boost visibility by enhancing or promoting your listings. We’ve also put together a handy guide in the Resource Centre on how to make your properties stand out.
What does each data point mean?
The analytics show how your listings are performing individually and across your portfolio:
- Views – How many times someone clicked to view your property in more detail.
- Enquiries – The total number of direct enquiries received.
- Conversion Rate – The percentage of viewers who went on to enquire.